

On 14 November, the Faculty of Physics – Engineering Physics, VNUHCM-University of Science inaugurated the Workshop on Marine Science and Sustainable Development, a special event marking the 20th anniversary of the establishment of the Oceanography discipline within the Department of Oceanography, Meteorology, and Hydrology. The opening ceremony took place in an exciting atmosphere, attended by many scientists, international experts, and young researchers who shared scientific perspectives on the ocean.
Speaking at the Opening Ceremony, Assoc. Prof. Trần Lê Quan—President of the University—expressed his honour in welcoming scientists, experts, and young researchers to this meaningful forum. The President of the University affirmed the critical role of the workshop: “Today’s event brings together scientists, experts, and young researchers to share the latest findings and innovative ideas aimed at a sustainable future for our oceans. This cooperation not only promotes marine science but also strengthens global connectivity in addressing shared challenges such as climate change, marine pollution, and sustainable coastal management.”
The Marine Science and Sustainable Development Workshop included 16 presentations, divided into three specialised discussion sessions:
Session 1: Marine Science and Sustainable Development
This session featured talks on the 20-year journey of OMH@HCMUS by Vo Luong Hong Phuoc; the advancement of coastal monitoring with indigenous HF radar development, presented by Hwa Chien; global trends in oceanic fronts and their implications for marine ecosystems, presented by Andrew Fischer, Kai Yang, and Phuc TD. Le; high-precision measurements in marine chemistry (DMS as example) surviving and advancing in any environment, presented by Sohiko Kameyama; and machine learning applications for classification and regression, presented by Quoc Pham.
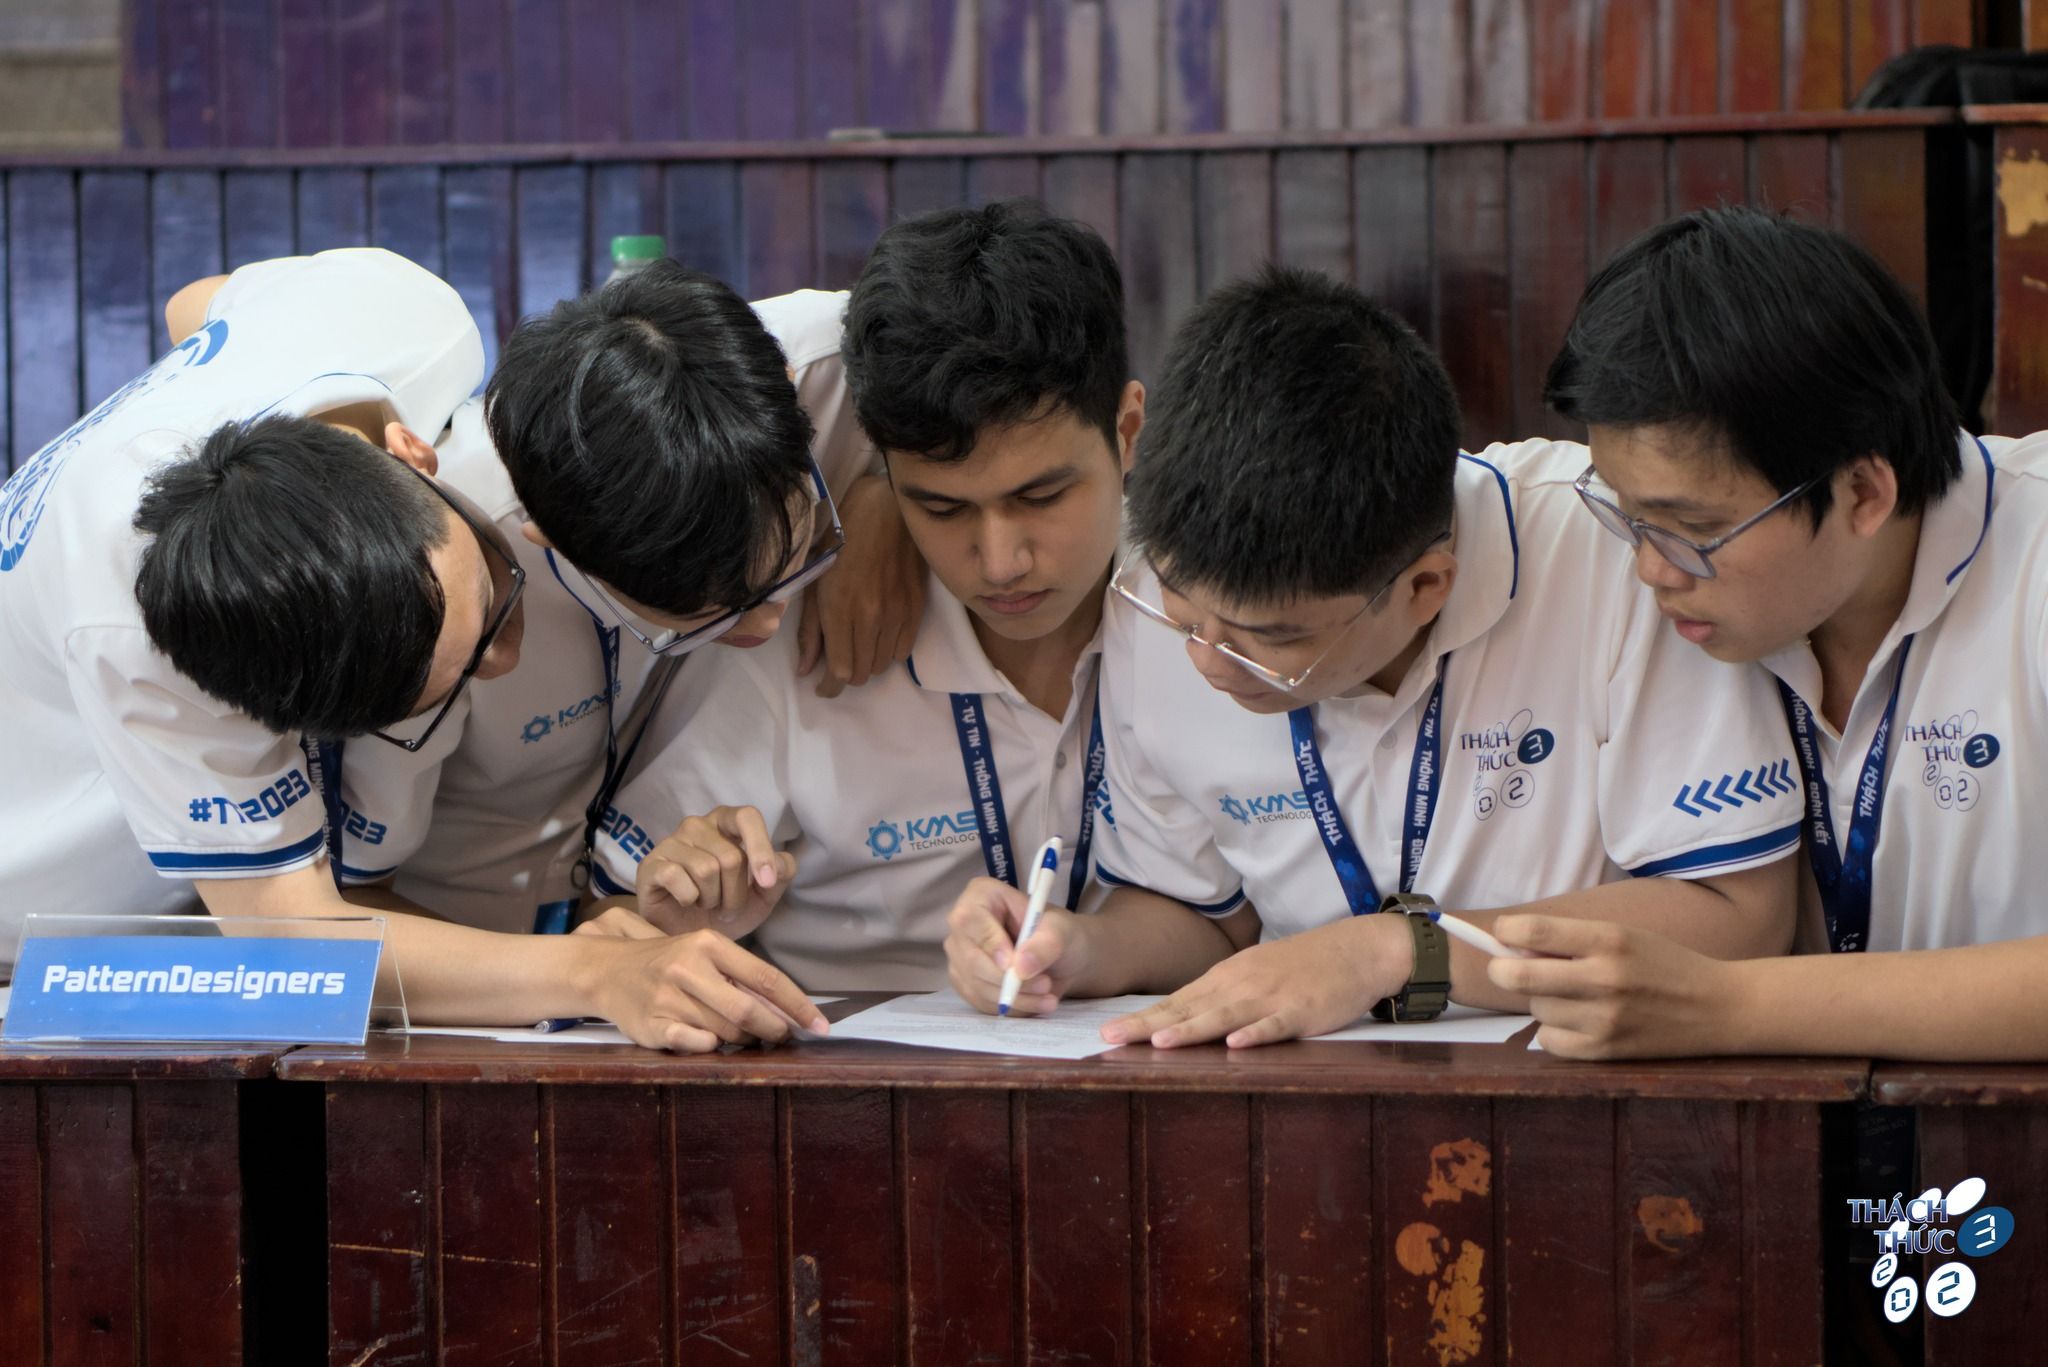
Thach Thuc Competition |
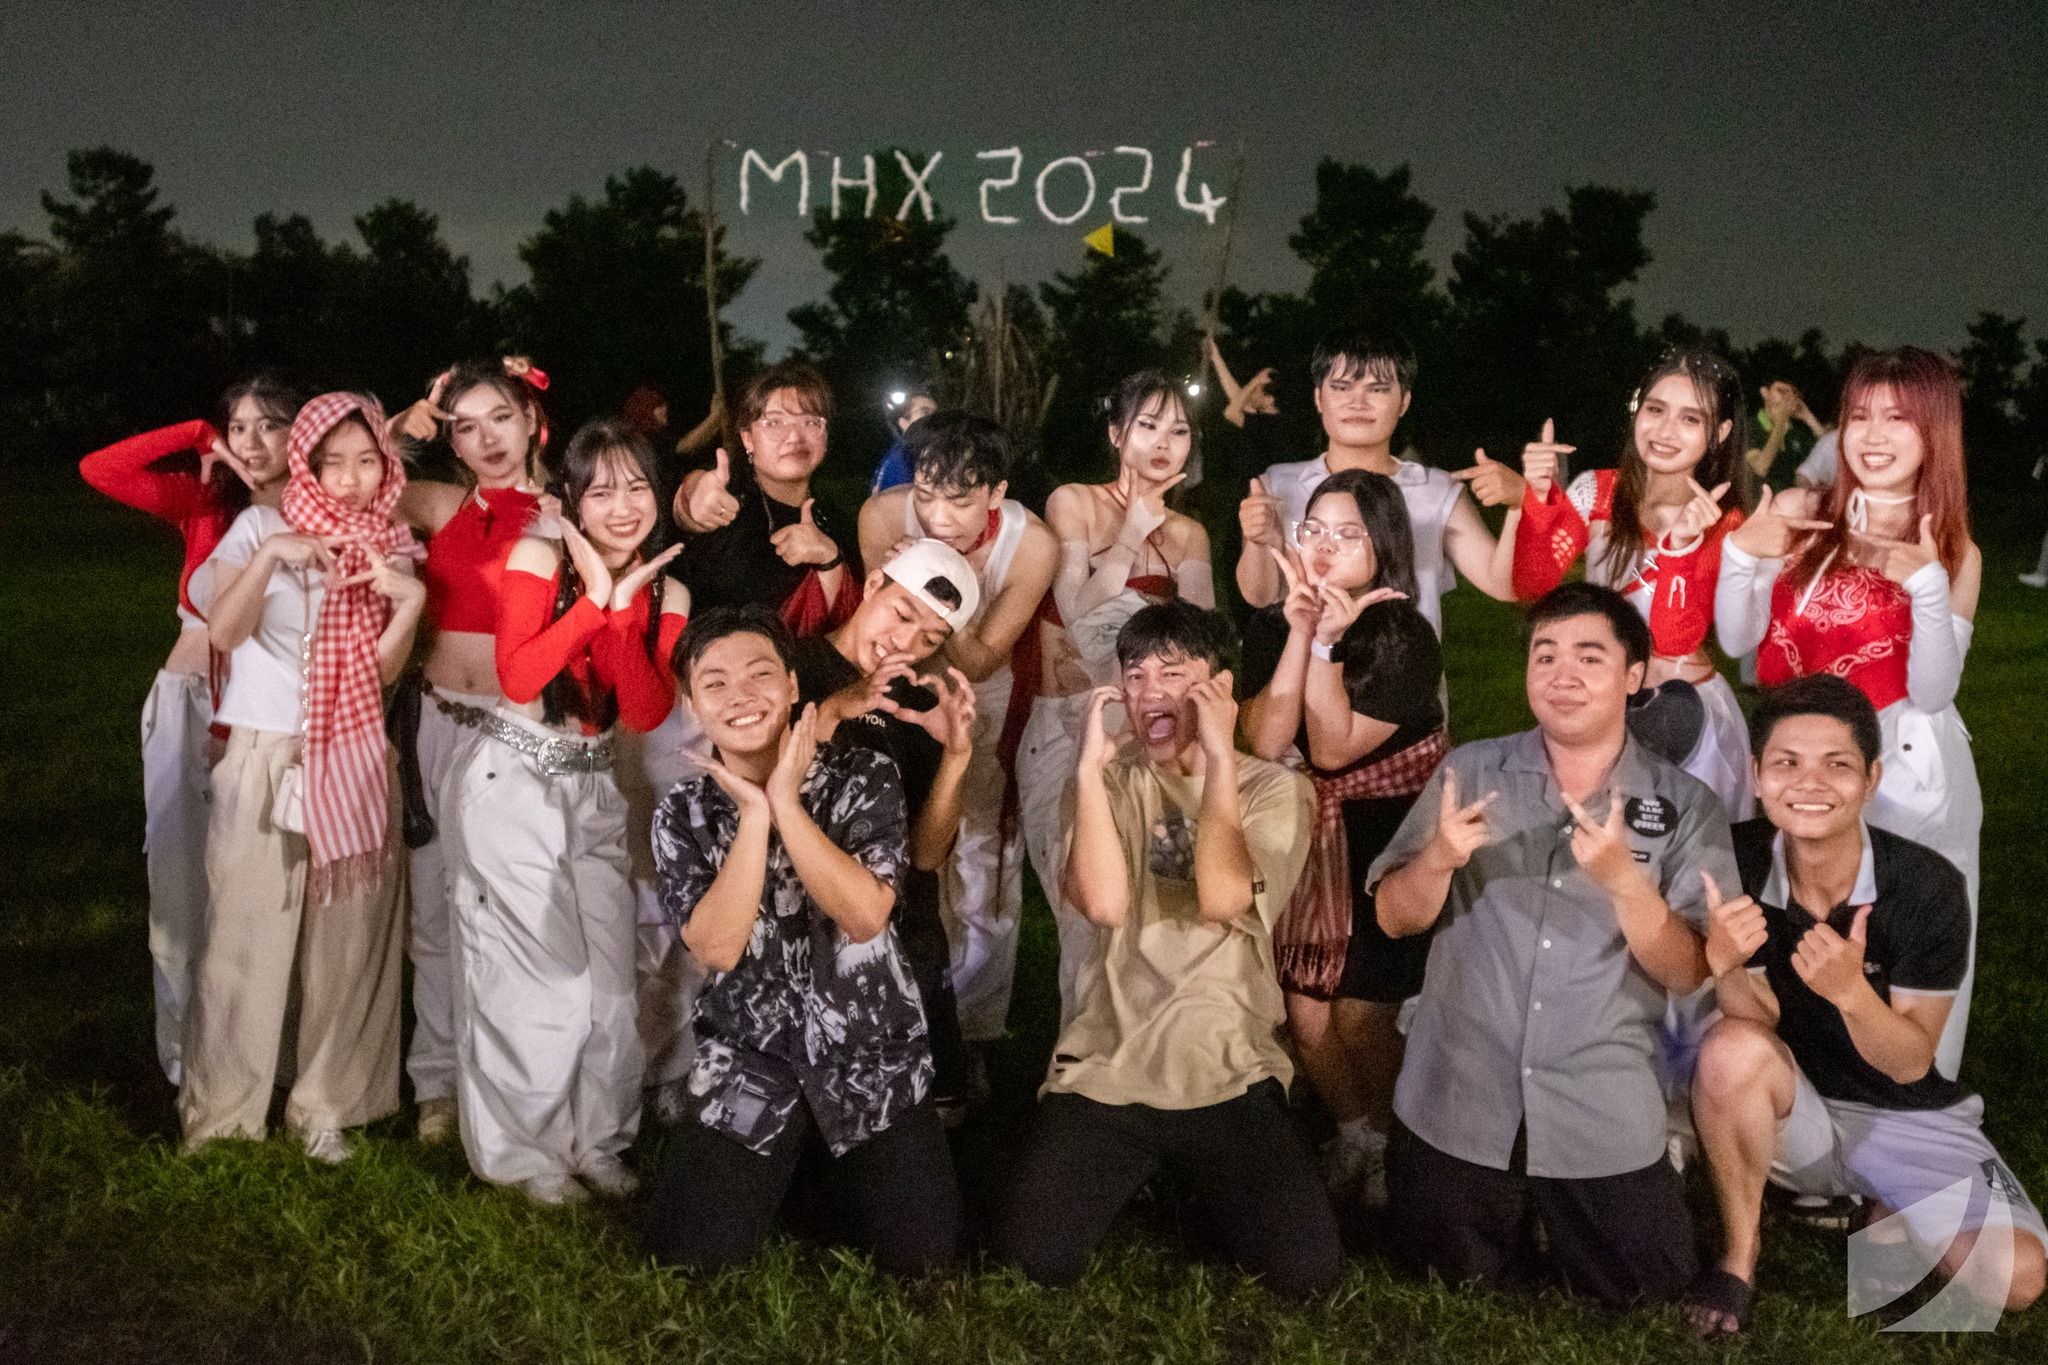
Mua He Xanh 2024 |
Session 2: Microplastics – From Research to Forecasting
This session focused on urgent environmental challenges, beginning with Chemicaldrift – a new open source ocean pollution model, presented by Lars R. Hole, Manuel Aghito, and Øyvind Breivik. Further presentations included surface water contamination with microplastics in Poland, detailing trends and challenges, by Piotr Zieliński and Karolina Mierzyńska; classification and prediction of microplastics by Vo Luong Hong Phuoc and colleagues; the challenges and opportunities of detection and classification of microplastics using artificial intelligence, presented by Pham The Bao and a large group of co-authors; and integrating AI and GIS for forecasting saltwater intrusion in Ho Chi Minh City, Viet Nam under climate change, presented by Vo Thi Kim Kieu, Pham Thi Tuyet Huyen, and Nguyen Kim Loi.
Session 3: River–Sea Processes and Coastal Zones
This session addressed dynamic environments, with topics covering the formation mechanism of a sand bar in Cua Dai – Thu Bon River mouth, presented by Vu Tuan Anh and Nguyen Thi Thuy Dung; sub-mesoscale flows and near-inertial motions in the Mississippi-Atchafalaya River plume in the Gulf of Mexico, presented by Pat Welch; water resource characteristics of the Mekong Delta, including current status, challenges, and sustainable management solutions, presented by Tran Dang An; the use of sand on a global scale and the impact on the marine environment, by Klaus Schwarzer; coastal protection strategies with nature-based solution for climate change adaptation in coastal Mekong Delta, presented by Le Xuan Tu; and shifting tidal dynamics in the Mekong Delta, unravelling the acceleration of tidal amplification and its anthropogenic roots, presented by Nguyen Cong Thanh, Tran Van Xuan, Nguyen Nghia Hung, and Dang Truong An.
| No. | Key performance | Index (2021-2025) |
| 1 | Number of Professors/ Assoc. Professors | Increase 10% each year |
| 2 | Ratio of Full-time students to teaching and research staff | 18 : 1 |
| 3 | Ratio of Doctorate degrees in teaching staff and lecturers | 75% |
| 4 | Average income of employees | Increase 10% each year |
| 5 | Capacity of Undergraduate students | ≤ 12.000 |
| 6 | Ratio of Postgraduate students to Graduate students | 20% |
| 7 | Ratio of Other training courses to Main programmes | 10% |
| 8 | Number of New education programmes | Undergraduate: 4 Postgraduate: 4 |
| 9 | Number of Programmes with dual majors | 2 |
| 10 | Number of Disciplines implementing integrated teaching, based on digital resources | 2 |
| 11 | Number of Programmes evaluated/accredited | 12 |
| 12 | Graduation rate | 80% |
| 13 | Percentage of Graduate students getting a job after 1 year | 90% |
| 14 | Quality accreditation at the institution level | 1 |
| 15 | Number of Programmes participating in international rankings | 3 |
| 16 | Number of Scopus/ Web of Science publications | 5.900 |
| 17 | Average ratio of international scientific papers to Doctoral staff | 1,5 |
| 18 | Strong research groups funded by VNUHCM | 5 |
| 19 | Potential research groups | 10 |
| 20 | Laboratories/ Laboratory areas/ Workspaces, cooperate or joint research with businesses and external partners | 2 |
| 21 | Number of Spin-off businesses formed from the university’s intellectual properties | 1 |
| 22 | Number of International cooperation programmes and projects | 5 |
| 23 | Sets of brand identities of HCMUS | 1 |
| 24 | Number of Science and technology cooperation programmes with localities | 3 |
| 25 | Total revenues from non-business activities and business activities | Increase 10% each year |
| 26 | Ratio of Tuition fees/Total revenues | ≤ 60% |
| 27 | Revenues from science and technology activities | Increase 10% each year |
| 28 | Ratio of Spending on scientific research to Total revenues | 8% |
| 29 | Ratio of Expenditures from the Universities’ revenues to Total regular operating expenses (From 2022) | 100% |
| 30 | Spending funds to re-investments | Increase 10% each year |
| 31 | Ratio of Construction floor areas to The total floor areas approved according to the planning 1/500 | 34.01% |
| 32 | Number of Laboratories invested in and equipment upgraded for research and education | 5 |
| 33 | Number of Infrastructure investment projects from funding sources | 1 |
| 34 | Number of External investors participating in investments to upgrade and equip lecture halls, classrooms, laboratories, etc., with capital from socialisation, public-private partnerships, leasing, joint ventures, associations, etc. | 2 |